Quick Start
1. Login
Go to http://track.houndtracking.com . Key in your user name and password on the login page, and press 'Enter'. Your username is all lower case e.g. user123456 .
![]()
2. Interface
You have entered the main interface of the tracking system. On the left, there is the work area. Here you work with panels like Monitoring, Tracks, Geofences, Jobs, Notifications and so on. These panels you choose in the Main menu above the work area.
On the right, there is usually the map.
Hound GPS interface is developed to be user friendly that is why we can choose the panels of main menu we need to work with. They are: Monitoring, Messages, Reports, Geofences, Notifications, Units (Main menu customizer helps us in this task).
![]()
Dragging the map with the left mouse button and zooming it with the mouse scroll, move to the location (city or town) which will be the basic for you in the tracking process.
3. User Settings
In order to choose user parameters click on the username in the right corner of the top panel and press the 'User settings' button in the dropdown menu. Afterwards, follow the steps:
   First and foremost, indicate your time zone.
   Secondly, indicate a type of daylight saving time used in your region.

Go to the Monitoring panel, you should see your unit on the map. If not, double click on the unit in work area to the left of the map.
![]()
4. Creating Geofences
Geofences are to be created in places of interest, which should get under control. For this, go to the 'Geofences' panel and press the 'New' button.
![]()
The simplest and quickest geofence type to create is circle with specified radius. Enter name for the geofence and select the type Circle. Then double-click on the map in the place of supposed geofence. Alter the radius if necessary and press 'Save'.
![]()
If you need a geofence of a more sophisticated form, choose type Polygon or Line. However, in this case a greater number of points is required to specify geofence's borders.
5. Notifications
Now we can create a notification about a unit entering a geofence. Go to the Notifications panel and press the 'Create Notification' button.
![]()
Moving through the dialog with the help of the 'Next' button, set the following parameters for the notification:
   Select your unit (tick it).
   Choose a control type (in our example we choose Geofence).
   Specify a check type (Inside geofence), and select necessary geofence(s) from the list below.
   Leave default notification text without changes.
   Choose a method of a notification delivery, for example, Display online notification in a popup window.
   Enter a name for the notification.
   Press ОК.
When the notification triggers, it will appear in the top right corner of the program.

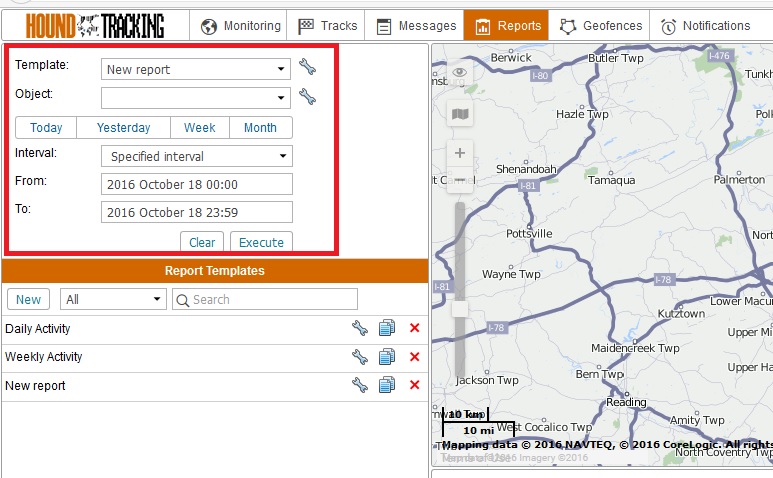
6. Reports
To switch to the Reports, click on the corresponding panel in the menu above the work area.
![]()
First of all, we need at least one report template to generate a report according to parameters set there. We are going to create a report template containing two tables (visits to geofences and speeding) and a chart.
To create a report template, go to the Reports panel and press the 'New' button. At the top of the template properties dialog, you see two important buttons — 'Add Table' and 'Add Chart'.

Press the 'Add Table' button and set table type to Geofences. On the left, tick the columns to be displayed in the resulting report. On the right, choose geofence(s). When finished, press OK. The table will be added to the report.

Then add the second table — press 'Add Table' again and choose a table of Speedings type. For this table we have set the parameter Speed limit in unit properties ('Advanced' tab). In additional parameters indicate that a speeding should last at least one minute (Min duration parameter). Press OK. The table will be added to the report.

Then press the 'Add Chart' button and select the necessary chart type (for example, mileage in trips). Note that for many charts to be generated the appropriate sensors are required. Press OK.

This is how our report template looks like after we have added two tables and a chart. Report contents are displayed on the left. Now give a name to the report and save it.

To obtain a report, set parameters in the work area: select report template, unit, reported interval, and press 'Execute'.
Generated report will appear on the right. On the left, you see tabs to navigate between report sections (tables and charts). Besides, the report can be exported to various formats or printed (for this, use the proper buttons — 'Export to File' and 'Print').


